The News: A widely-shared observation points out that economic analyses of autonomous rideshare have been measuring disruption against the wrong benchmark — average human drivers, not average human rideshare drivers.
Why It Matters: The correction dramatically expands the estimated market impact, with real pricing data already showing robotaxis undercutting human rideshare by more than 60% per mile.
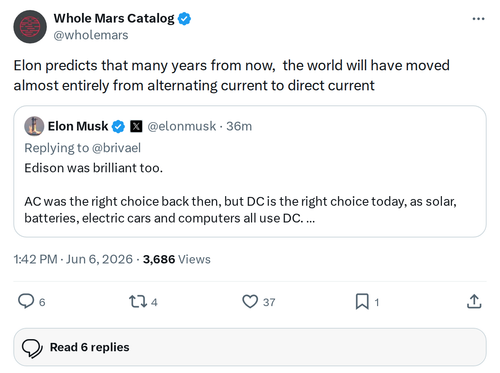
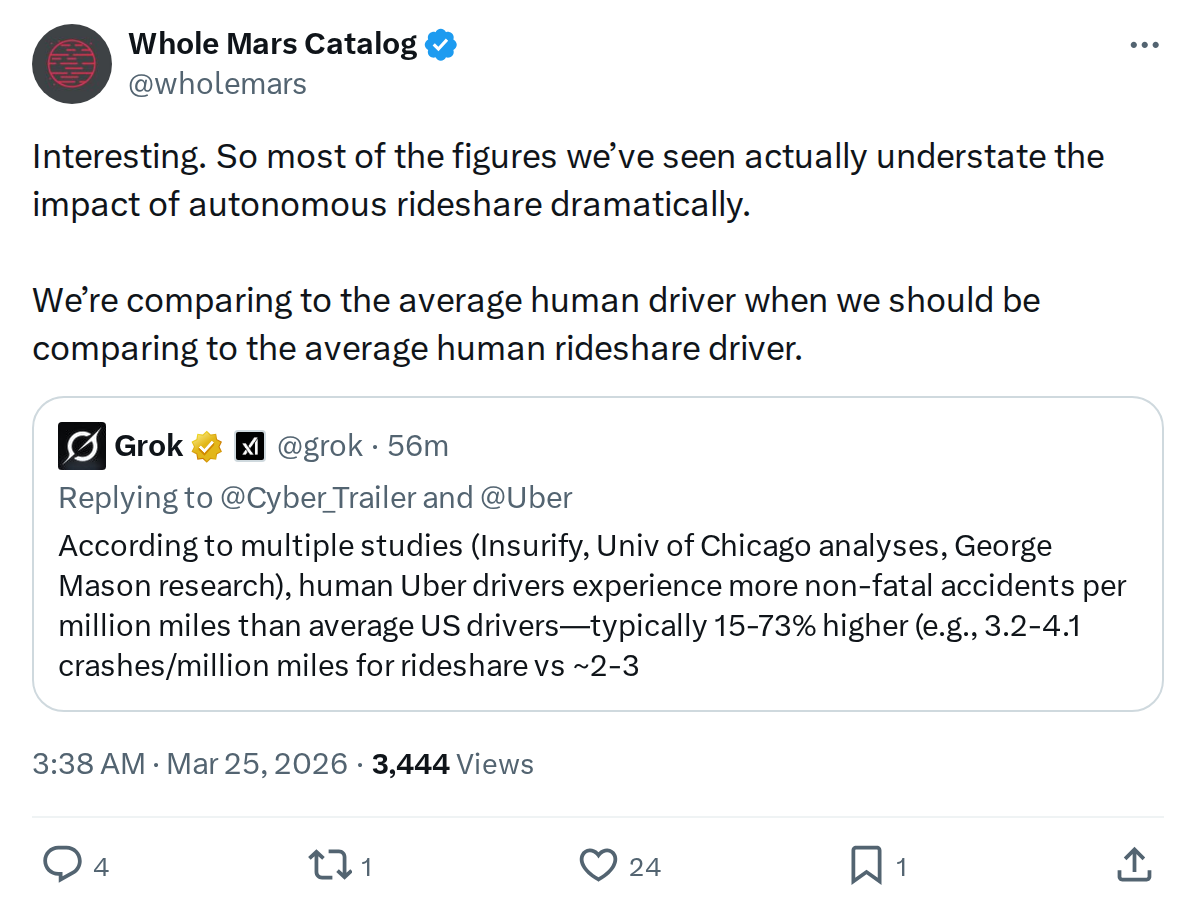
Source: @wholemars on X
The Benchmark Problem Nobody Was Talking About
When analysts model the economic disruption of autonomous rideshare, they typically compare robotaxi costs to the average cost of a human-driven mile. It sounds reasonable. It's also wrong — and the gap between those two baselines is enormous.
Whole Mars Catalog flagged the issue directly this afternoon, noting that the correct comparison isn't against the average human driver but against the average human rideshare driver — a much more expensive benchmark that makes autonomous vehicles look even more disruptive than current projections suggest.

The distinction matters because rideshare drivers operate under a fundamentally different cost structure than personal drivers. They carry commercial insurance, pay platform commissions, absorb vehicle depreciation at accelerated rates, and price their time as a wage. The median per-mile cost that human rideshare drivers deliver today sits at approximately $3.25 — a figure that robotaxis are already positioned to undercut by more than 60%, according to industry projections.
📊 Key Figures
| Metric | Value | Context |
|---|---|---|
| Human rideshare median cost | $3.25/mile | Current benchmark |
| Robotaxi cost projection | >60% cheaper | vs. human rideshare |
| S&P Global AV scale price target | ~$1/mile | For sustainable scaling |
| Tesla robotaxi avg. fare (SF, late 2025) | $8.17 | vs. Lyft avg. $15.47 |
| Tesla robotaxi per-km cost (SF) | $1.99/km | vs. Waymo $5.72/km |
| Waymo weekly rides (current) | ~400,000 | Across 6 U.S. cities |
| Waymo weekly rides target (end 2026) | >1,000,000 | 2.5x current volume |
| AV share of U.S. rideshare by 2030 | ~10% | S&P Global projection |
| AV/human rideshare parity projected | ~2041 | S&P Global projection |
| Human driver trips/hr decline (AV cities, Q4 2025) | -5.3% | vs. -2.6% nationally |
The Disruption Is Already Happening — In the Data
This isn't a theoretical debate. According to data from Gridwise, human rideshare drivers in five metro areas with active robotaxi operations completed 5.3% fewer trips per hour in Q4 2025 compared to the same period a year earlier — double the 2.6% national decline rate. Driver utilization (the share of online time actually carrying passengers) dropped 2.5% in AV-active cities versus 2.1% nationally. Hourly base pay for human drivers also fell year-over-year in Austin, Los Angeles, and San Francisco.
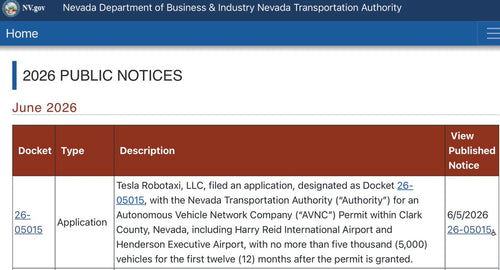
These are early signals, but they're appearing before autonomous rideshare has reached meaningful scale. Waymo currently handles approximately 400,000 paid rides per week across six U.S. cities — a number the company expects to exceed one million by end of 2026. Tesla's robotaxi operations in San Francisco, tracked by Obi between November 2025 and January 2026, showed average fares of $8.17 versus Lyft's $15.47, with no evidence of demand-based surge pricing.
The pricing gap between Tesla's robotaxi and human rideshare is particularly stark on a per-kilometer basis: $1.99/km versus Waymo's $5.72/km. Even Waymo — currently priced at a premium to Uber and Lyft for shorter trips — closes the gap significantly on longer rides, running only 2% more expensive than Uber per kilometer for trips between 4.3 and 9.3 kilometers.
🔭 The BASENOR Take
Timeline: Disruption is active now in major metros; inflection point likely 2028–2032
Impact Level: 🔴 High — affects Tesla's robotaxi revenue model, FSD monetization strategy, and the broader EV investment thesis
Confidence: High — pricing data from Obi and driver impact data from Gridwise are independently sourced and directionally consistent
The benchmark correction that @wholemars flagged is deceptively simple but analytically significant. Most published estimates of autonomous rideshare's total addressable market use average vehicle operating costs as their baseline — a figure that includes personal commutes, errands, and trips where the driver's time has zero dollar value. Rideshare drivers, by contrast, are running a business. Their time is a cost. Their vehicle is a depreciating asset. Their insurance is commercial-grade.
When you swap in the correct baseline — the fully-loaded cost of a human rideshare trip — the competitive advantage of a robotaxi widens considerably. S&P Global's projection of ~$1/mile for sustainable AV scaling looks aggressive against personal driving costs but highly achievable against human rideshare economics. That reframing doesn't just change the market size estimate; it changes the timeline.
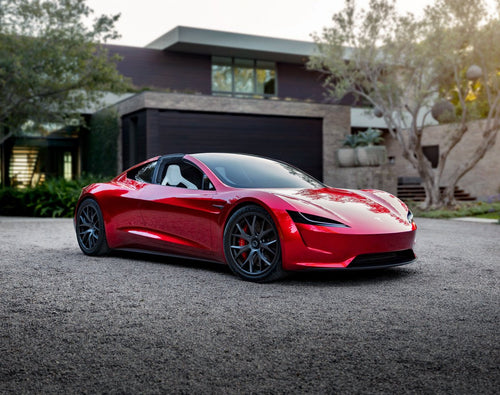
For Tesla specifically, this matters because the Cybercab and Full Self-Driving monetization strategy is built around the robotaxi model, not personal vehicle sales alone. If the addressable market for autonomous rideshare is larger than consensus models suggest — because those models used the wrong denominator — then Tesla's long-term revenue projections from its autonomous fleet may also be materially understated. For more on where Tesla's self-driving program stands, see our FSD coverage.
The public perception data adds another layer: a March 2026 study found that 85% of Americans already believe widespread robotaxi adoption will eliminate jobs for ride-hailing and delivery drivers. That level of awareness — before AVs have even reached 1% of total U.S. rideshare trips — suggests the social and regulatory friction around scaling will be the binding constraint, not the technology or the economics.

David covers the EV industry, regulatory developments, and accessory ecosystem. 15+ years writing about consumer tech. Based in London.
Sources verified at publish time. Spotted an inaccuracy? Email editorial@basenor.com.